The Lofdal Heavy Rare Earth Project is one of the most advanced and strategically significant heavy rare earth development projects globally, with a focus on dysprosium, terbium and yttrium, critical inputs for high-performance permanent magnets, phosphors and advanced materials.
Backed by JOGMEC (Japan Organization for Metals and Energy Security) and Toyota Tsusho Corporation, Lofdal is being advanced as a key future supply source for the global magnet supply chain.
Dec. 2025 PFS Highlights
- Avg. Annual Production – 2,000 tpa TREO
- Includes 119 t Dysprosium, 18 t Terbium and 841 t Yttrium
- Mine Life – 13 years
- Capital Cost – $348 million USD (includes 20% Contingency)
- NPV – Base Case – $275 million USD after tax Divergent Case – $748 million USD after tax
- IRR – Base Case – 19% after tax Divergent Case – 35% after tax
Strategic Partners
Japan-Backed Development Platform
- JOGMEC funding and technical support
- Toyota Tsusho industrial and commercial integration
- Alignment with Japanese government supply chain priorities
Why Heavy Rare Earths Matter
- Dysprosium & terbium enable heat-resistant magnets
- Essential for EV drivetrains and offshore wind
- Key elements in ceramic high temperature coatings in turbines and jet engines
- Supply is highly concentrated in China
- Lofdal addresses a critical supply gap
Partnership with JOGMEC on Lofdal
On January 27, 2020 the Company announced that it had signed an agreement with Japan Oil, Gas and Metals National Corporation (“JOGMEC”) to jointly explore, develop, exploit, refine and/or distribute mineral products from Lofdal. The agreement provides JOGMEC with the right to earn a 50% interest in the project by funding $23,000,000 in exploration and development expenditures under the following terms:
Term 1 – JOGMEC will fund $3,000,000 in exploration expenditures up to March 31, 2021. The first term funding amount is non-refundable and JOGMEC earns no interest in the Lofdal project;
Term 2 – JOGMEC is entitled to elect to contribute an additional $7,000,000 in exploration expenditures from April 1, 2021 – March 31, 2024 to earn a 40% interest in the Lofdal project;
Term 3 – JOGMEC is entitled to elect to contribute an additional $13,000,000 in exploration and development expenditures from April 1, 2024 – March 31, 2028 to earn an additional 10% interest in the Lofdal project.
Once JOGMEC has completed and exercised its 50% earn-in and a feasibility study has been completed on the project, JOGMEC has the right to purchase an additional 1% interest in the project from the Company for $5,000,000 and thereafter to exclusively provide funding to develop the project subject to the Company’s interest in the Project not being diluted below 21%. 5% interest in the project is held by Historically Disadvantaged Namibian entity as part of the mining license obligations.
JOGMEC is a Japanese government independent administrative agency which among other things seeks to secure stable resource supply for Japan. JOGMEC has a strong reputation as a long term, strategic partner in mineral projects globally. The mandated areas of responsibilities within JOGMEC relate to oil and natural gas, metals, coal and geothermal energy. JOGMEC facilitates opportunities with Japanese private companies to secure supply of natural resources for the benefit of the country’s economic development.
Rare earths are of critical importance to Japanese industrial interests and JOGMEC has extensive experience with all aspects of the sector. JOGMEC provided Lynas Corporation with US$250,000,000 in loans and equity in 2011 to ensure supplies of these crucial metals from the Mount Weld Project in Australia to Japanese industry.
Rare Earth Mineralization at Lofdal
The Lofdal property is centered on the Neoproterozoic Lofdal intrusive complex, a regional geological feature associated with numerous occurrences of rare earth element (REE) mineralization. The REE mineralisation is bound to zones of hydrothermal alteration, predominantly albitization and carbonatization, associated with carbonatite dykes of variable thickness.
Exploration results have demonstrated the occurrence of heavy rare earth (HREE) mineralization on a district scale. The mineralized zones stretch in northeasterly directions over a prospective area of about 20 km by 10 km (Figure 1).
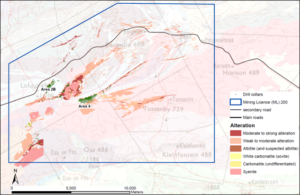
Figure 1: Regional-scale, structurally controlled alteration zones carry the HREE-mineralization at Lofdal. The mineralized system is covered by the Company’s Mining License 200.
The two mineralized zones that have been evaluated by recent resource drilling are “Area 4” and “Area 2B”, (Figure 3). At Area 4, the zone of alteration has been traced for over 1,100 m at surface, where it is characterised by an intensely altered core of 15 m to 30 m thickness with a less altered halo of 50 m to 60 m that extends up to 100 m in thickness. The alteration zone at Area 2B has been traced along a strike length of 600 m and its thickness ranges from 20 m to 35 m, thinning to less than 10 m in the central section of the deposit. Regional sampling and mapping suggest that the mineralisation for both deposits may extend for several kilometres along strike.

Figure 2 Simplified geology of the central Lofdal project area showing the location of the Area 4 and Area 2B deposits in relation to other structures with rare earth mineralization which underwent reconnaissance drilling
Drilling Program (2020)
Drilling in 2020 focused on extending the mineral resource in Area 4 and confirming the resource potential in Area 2B. Reconnaissance drilling on the Northern Splay and Dolomite Hill targets confirmed HREE mineralization but did not return significant results for resource development. Drill target areas identified at Lofdal for resource development are shown in Figure 4.
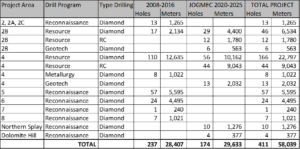
Total drilling at the Lofdal project to date is 58,039 m (Table 1).
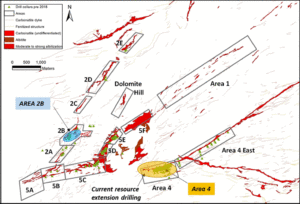
Figure 3 – Drill target areas at Lofdal for resource development. In 2020-2023, focus was on Area 4. Area 2B is the first satellite deposit with resource drilling.
Table 1 – Summary of drilling conducted at the Lofdal Project
Infill drilling at Area 4 and Area 2B for PFS Lofdal “2B-4”
A resource infill and expansion drilling program was conducted at Area 4 and Area 2B between 2021 and 2023 which forms part of the Pre-Feasibility Study (“PFS”) of the significantly expanded “Lofdal 2B-4” Project (Figure 5). The drill program was developed by the Company with the support of The MSA Group, to increase the level of resource categories as required for the PFS.
Resource infill drilling was completed in November 2023 which brought total drilling for Area 2B and Area 4 to 268 holes with a total of 40,153 m of both diamond core drilling (DC) and reverse circulation drilling (RC).
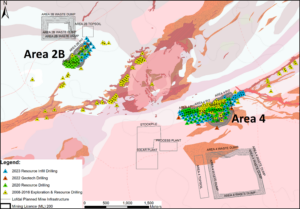
Figure 4 Drill collars in the central Lofdal project area. Blue triangles indicate the collar positions of 2023 RC infill drilling
Updated Mineral Resource 2024
The MSA Group (Pty) Ltd of South Africa (“MSA”) was contracted to update the Mineral Resource Statement for Lofdal’s Areas 2B and 4. The Mineral Resource was estimated using the Canadian Institute of Mining, Metallurgy and Petroleum (“CIM”) Best Practice Guidelines and is reported in accordance with the 2014 CIM Definition Standards, which have been incorporated by reference into National Instrument 43-101 – Standards of Disclosure for Mineral Projects (“NI 43-101”).
MSA completed a site visit to review all technical aspects of the project including the Company’s standard operating procedures and quality assurance quality control (“QAQC”) programs. Considerable time was dedicated to vetting the geological model and continuity of the mineralization. Field operations follow strict company Standard Operating Procedures regarding drilling practices, sampling procedures, security of transport and analytical procedures as per recommendations in the Canadian Institute of Mining, Metallurgy and Petroleum CIM’s Best Practices Guidelines (2018), which includes strict internal QAQC procedures for the insertion of blanks, standards and duplicates. QAQC samples account for 10% of samples submitted in each batch. The Mineral Resource Estimate (“MRE”) was based on geochemical analyses and density measurements of core samples obtained by diamond drilling and samples obtained from RC drilling undertaken by Namibia Rare Earths from 2010 to 2012, in 2015, and by NMI (under the JOGMEC program) from 2020 to 2023.
Sample preparation and analytical work for the drilling program was provided by Activation Laboratories Ltd. (“Actlabs”) in Windhoek, Namibia and Ancaster, Ontario. Actlabs is an ISO/IEC 17025 accredited laboratory. Half core samples of one-meter lengths intervals were taken for analysis. The bagged core samples were given a unique sample reference number and dispatched for preparation at Actlabs’ sample preparation facility in Windhoek. The core samples were crushed to 2 mm, split using a riffle splitter and pulverised to 105 µm. Pulverised sub-samples were homogenised in a stainless-steel riffle splitter and a 15 g sample and duplicate were drawn for analysis. The pulverised sample aliquots were shipped to the ISO/IEC 17025 accredited Actlabs analytical facility in Ancaster, Ontario, Canada. The REE’s were assayed using lithium metaborate-tetraborate fusion and Inductively Coupled Plasma Mass Spectrometry (ICP-MS). Samples from RC drilling were collected at the drill rig’s cyclone (“A-sample”) and submitted to Actlab’s preparatory laboratory in Windhoek, Namibia, in batches of 200 to 300 samples. The samples were dried and crushed to 2 mm, split using a riffle splitter and pulverised to 105 µm. Pulverised sub-samples were homogenised in a stainless-steel riffle splitter and a 15 g sample and duplicate were drawn for analysis.
The samples were subjected to a quality assurance and control (QAQC) program consisting of the insertion of blank samples and certified reference materials at Lofdal and the preparation of a laboratory duplicate at the sample preparation facility in Windhoek. The primary laboratory assay values were confirmed by duplicate samples assayed by a second laboratory (ALS Global, Johannesburg, South Africa). MSA was satisfied that the assay results are of sufficient accuracy and precision for use in Mineral Resource estimation.
A three-dimensional geological model of the REE mineralisation and weathering surface was constructed using the drill hole and trench data. A mineralised envelope was defined. The grades of the individual light rare earth oxides (LREO) and individual heavy rare earth oxides (HREO) were estimated using ordinary kriging into a block model for each deposit. Density was estimated using inverse distance weighting. From the assumed parameters a 0.1% TREO cut-off grade was calculated (TREO refers to Total Rare Earth Oxides including Y2O3), which together with the Whittle optimised pit shell demonstrates reasonable prospects for eventual economic extraction (RPEEE) for the Mineral Resource. The Mineral Resource is classified into the Measured, Indicated and Inferred categories and is reported at a cut-off grade of 0.1% TREO.
Mineral Resource Statement of April 2024
The Mineral Resource is classified into the Measured, Indicated and Inferred categories and is reported at a cut-off grade of 0.1% total rare earth oxides (TREO). A summary of the Mineral Resource estimates is shown in Table 2 for Area 4 and Table 3 for Area 2B.
The Mineral Resource is presented at a variety of cut-off grades as shown in Table 4 (Measured and Indicated) and Table 5 (Inferred) for Area 4, and Table 6 (Indicated) and Table 7 (Inferred) for Area 2B.
The following notes apply to Tables 2 to 7:
- All tabulated data have been rounded and as a result minor computational errors may occur.
- Mineral Resources, which are not Mineral Reserves, have no demonstrated economic viability.
- *TREO = Total Rare Earth Oxides and includes Y2O3
- **HREO = Total Heavy Rare Earth Oxides and includes Y2O3
- ***LREO = Total Light Rare Earth Oxides
Table 2 Area 4 Mineral Resource Estimate above 0.1% TREO* cut-off grade
| Category | Tonnes (Mt) |
TREO* % |
HREO** % |
LREO*** % |
Dy2O3 ppm |
TREO* (kt) |
| Measured | 6.6 | 0.21 | 0.14 | 0.07 | 130 | 13.7 |
| Indicated | 49.2 | 0.15 | 0.07 | 0.08 | 69 | 75.7 |
| Measured & Indicated | 55.8 | 0.16 | 0.08 | 0.08 | 76 | 89.4 |
| Inferred | 10.5 | 0.14 | 0.06 | 0.08 | 58 | 15.0 |
Table 3 Area 2B Mineral Resource Estimate above 0.1% TREO* cut-off grade
| Category | Tonnes (Mt) |
TREO* % |
HREO** % |
LREO*** % |
Dy2O3 ppm |
TREO* (kt) |
| Indicated | 2.7 | 0.16 | 0.09 | 0.07 | 97 | 4.4 |
| Inferred | 4.4 | 0.15 | 0.07 | 0.08 | 75 | 6.6 |
Table 4 Area 4, Measured and Indicated Resources Grade-Tonnages
| Cut-off TREO % | Tonnes (Mt) |
TREO* % |
HREO** % |
LREO** % |
Dy2O3 ppm | TREO (kt) |
| 0.10 | 55.8 | 0.16 | 0.08 | 0.08 | 76 | 89.4 |
| 0.15 | 20.4 | 0.23 | 0.13 | 0.10 | 120 | 46.5 |
| 0.20 | 8.4 | 0.31 | 0.20 | 0.11 | 186 | 26.0 |
| 0.25 | 4.2 | 0.40 | 0.29 | 0.11 | 262 | 16.8 |
| 0.30 | 2.6 | 0.48 | 0.38 | 0.10 | 333 | 12.4 |
Table 5 Area 4, Inferred Resources Grade-Tonnages
| Cut-off TREO % | Tonnes (Mt) |
TREO* % |
HREO** % |
LREO*** % |
Dy2O3 ppm | TREO (kt) |
| 0.10 | 10.5 | 0.14 | 0.06 | 0.08 | 58 | 15.0 |
| 0.15 | 3.4 | 0.18 | 0.08 | 0.11 | 76 | 6.3 |
| 0.20 | 0.7 | 0.24 | 0.12 | 0.12 | 118 | 1.7 |
| 0.25 | 0.2 | 0.30 | 0.20 | 0.09 | 193 | 0.6 |
Table 6 Area 2B, Indicated Resources Grade-Tonnages
| Cut-off TREO % | Tonnes (Mt) |
TREO* % |
HREO** % |
LREO*** % |
Dy2O3 ppm | TREO (kt) |
| 0.10 | 2.7 | 0.16 | 0.09 | 0.07 | 97 | 4.4 |
| 0.15 | 1.3 | 0.21 | 0.11 | 0.10 | 117 | 2.7 |
| 0.20 | 0.6 | 0.25 | 0.12 | 0.13 | 133 | 1.5 |
| 0.25 | 0.3 | 0.29 | 0.14 | 0.15 | 150 | 0.8 |
Table 7 Area 2B, Inferred Resources Grade-Tonnages
| Cut-off TREO % | Tonnes (Mt) |
TREO* % |
HREO** % |
LREO*** % |
Dy2O3 ppm | TREO (kt) |
| 0.10 | 4.4 | 0.15 | 0.07 | 0.08 | 75 | 6.6 |
| 0.15 | 1.6 | 0.20 | 0.09 | 0.11 | 96 | 3.3 |
| 0.20 | 0.6 | 0.25 | 0.10 | 0.15 | 111 | 1.6 |
| 0.25 | 0.2 | 0.31 | 0.10 | 0.20 | 115 | 0.8 |
Table 8 Area 4 Mineral Resource Estimate above 0.1% TREO* cut-off grade
| Class | Tonnes
Mt |
TREO* % |
La2O3 ppm |
Ce2O3 ppm |
Pr2O3 ppm |
Nd2O3 ppm |
Sm2O3 ppm |
Eu2O3 ppm |
Gd2O3 ppm |
Tb2O3 ppm |
Dy2O3 ppm |
Ho2O3 ppm |
Er2O3 ppm |
Tm2O3 ppm |
Yb2O3 ppm |
Lu2O3 ppm |
Y2O3 ppm |
| Measured | 6.57 | 0.21 | 173 | 313 | 34 | 124 | 42 | 18 | 81 | 19 | 130 | 28 | 83 | 12 | 76 | 11 | 935 |
| Indicated | 49.22 | 0.15 | 217 | 383 | 40 | 145 | 40 | 14 | 55 | 11 | 69 | 14 | 41 | 6 | 36 | 5 | 463 |
| M&I | 55.79 | 0.16 | 211 | 374 | 39 | 142 | 40 | 15 | 58 | 12 | 76 | 16 | 46 | 7 | 41 | 6 | 519 |
| Inferred | 10.52 | 0.14 | 217 | 389 | 42 | 150 | 40 | 13 | 49 | 9 | 58 | 12 | 34 | 5 | 30 | 4 | 369 |
Notes:
- All tabulated data have been rounded and as a result minor computational errors may occur.
- Mineral Resources, which are not Mineral Reserves, have no demonstrated economic viability.
- *TREO = Total Rare Earth Oxides and includes Y2O3
Table 9 Comparison of Lofdal Mineral Resource Estimates of 2021 and 2024 at a 0.1% TREO cut-off grade
| Year of Mineral Resource Estimate | 2021 | 2024 | ||
| Million tonnes | Grade | Million tonnes | Grade | |
| (Mt) | %TREO | (Mt) | %TREO | |
| Measured Resource Area 4 | 5.93 | 0.21 | 6.6 | 0.21 |
| Indicated Resource Area 4 | 36.63 | 0.16 | 49.2 | 0.15 |
| Indicated Resource Area 2B | 2.2 | 0.19 | 2.7 | 0.16 |
| Total Measured & Indicated Resources | 44.76 | 0.17 | 58.5 | 0.16 |
| Inferred Resource Area 4 | 6.09 | 0.17 | 10.5 | 0.14 |
| Inferred Resource Area 2B | 2.58 | 0.19 | 4.4 | 0.15 |
| Total Inferred Resources | 8.67 | 0.17 | 14.9 | 0.14 |
Table 10 Comparison of contained TREO, Dysprosium oxide and Terbium oxide in Mineral Resource Estimates of 2021 and 2024 at a 0.1% TREO cut-off grade
| TREO | Dy2O3 | Tb2O3 | ||||
| Year of Mineral Resource Estimate | 2021 | 2024 | 2021 | 2024 | 2021 | 2024 |
| tonnes | tonnes | tonnes | tonnes | tonnes | tonnes | |
| Measured Resources | 12,710 | 13,650 | 820 | 855 | 120 | 124 |
| Indicated Resources | 59,970 | 80,081 | 3,240 | 3,648 | 500 | 568 |
| Total Measured & Indicated Resources | 72,680 | 93,731 | 4,060 | 4,503 | 620 | 692 |
| Total Inferred Resources | 10,120 | 21,602 | 680 | 937 | 110 | 153 |
Preliminary Feasibility Study Lofdal “2B-4”
The company completed a Preliminary Feasibility Study (“Pre-Feasibility Study” or “PFS”) on the expanded project Lofdal “2B-4” (filed on Sedar on 13 January 2026, see Press Release “Namibia Critical Metals Inc. Files NI 43-101 Pre-Feasibility Study Technical Report for the Lofdal Heavy Rare Earths “2B-4” Project”) based on the parameters and outcome of the PEA in 2022. SGS Bateman was contracted as lead consultant to oversee the study process and integrate all specialists’ contributions. The key consultancies for the PFS are:
| SRK, South Africa | Geotechnical studies |
| SLR, Namibia | Environmental Impact Assessment, Water Supply |
| The MSA Group, South Africa | Geological Model and Mineral Resource Estimate |
| SGS Bateman, South Africa | Engineering design, financial model, overall lead and integration |
| SGS Lakefield, Canada | Process development (flotation and hydrometallurgy) |
| KnightPiesold, Namibia | Tailings facility, tailings management |
| CREO, Namibia | Infrastructure, Water and Electricity Supply |
| Qubeka Consultants, Namibia | Mine model, mine plan, mineral reserves |
Economic Analysis
The economic analysis assumes that the project will be 100% equity financed and uses parameters relevant as of December 2025, under conditions likely to be applicable to project development and operation and analyzes the sensitivity of the project to changes in the key project parameters. All costs have been presented in United States Dollars (USD) and wherever applicable conversion from South African Rand (ZAR) has utilized an exchange ratio (ZAR/USD) of 18.23.
Mining and treatment data, capital cost estimates and operating cost estimates have been put into a Base Case and Divergent Case financial model to calculate the IRR and NPV based on calculated Project after tax cash flows. For the purposes of the PFS, the evaluation is based on 100% of the project cash flows before distribution of profits to the equity owners. Both, pre-tax and after-tax cash flows have taken 5% royalty payments into account.
Under the Base Case, the Lofdal “2B-4” generates consistent positive after-tax cash flows throughout the 13 years mine life following construction, with cumulative after-tax cash flow turning positive early in operations and increasing steadily to closure.
The project is expected to pay back initial capital within the first 4.2 years (Base Case) and alternatively in 2.75 years (Divergent Case).
| Metric | Base Case | Divergent Case |
| Net Present Value
(NPV, discount rate 5%) |
Pre-tax: USD389.2 million
After-tax: USD275.5 million |
Pre-tax: USD1,245.6 million
After-tax: USD747.9 million |
| Internal Rate of Return
(IRR) |
Pre-tax: 21.7%
After-tax: 19.0% |
Pre-tax: 44.1%
After-tax: 34.8% |
| Life-of-Mine Nominal Cash Flow | Pre-tax: USD709.6 million
After-tax: USD513.1 million |
Pre-tax: USD2,027.4 million
After-tax: USD1,242.3 million |
| Pre-Production Capital Costs | USD273.4 million | Same as Base Case |
| Total Capital Costs | USD347.9 million
(including contingency of USD57.4 million) |
Same as Base Case |
| Capital Payback Period
(after-tax) |
4.2 years | 2.75 years |
| Average Annual Production | 1,478 tonnes TREO (ex La, Ce), including: 119 t Dy203, 17.8 t Tb203, 841 t Y203 | Same as Base Case |
| Mine Plan | 32 Mt Proven and Probable Reserves | Same as Base Case |
| Estimated Life of Mine | 13-year mine life | Same as Base Case |
| Rare Earth Oxide Prices Used (average Life of Mine) | Dy203: USD663/kg
Tb203: USD2,880/kg Y203: USD60/kg Nd203: USD114/kg Pr6011: USD119/kg |
Dy203: USD855/kg
Tb203: USD3,712/kg Y203: USD130/kg Nd203: USD146/kg Pr6011: USD152/kg |
| Basket Price
(average Life of Mine pricing) |
USD158/kg excluding La,Ce | USD230/kg excluding La,Ce |
Summary of financial analysis of the PFS Lofdal “2B-4”

Sensitivity Analysis
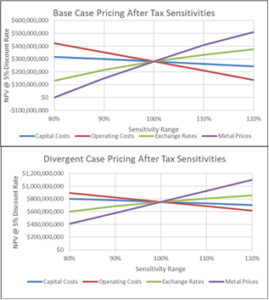
The Pre-Feasibility Study confirms that the project delivers strong early cash flow, rapid capital recovery, and economic resilience under conservative pricing assumptions, with upside leverage under divergent rare earth pricing scenarios. Lofdal exhibits high sensitivity to yttrium pricing due to its HREE dominant basket.
The after-tax sensitivity analysis demonstrates that:
- Metal prices are the dominant value driver, with a ±20% change generating the largest impact on NPV in both, Base and Divergent cases.
- Operating costs represent the second-most influential variable; however, the project retains a positive after-tax NPV across all tested cost ranges.
- Exchange rate movements provide additional economic leverage, with a weaker local currency significantly enhancing project value.
- Capital costs show moderate sensitivity, confirming that the project’s value is not disproportionately dependent on Capex precision.
Under the Base Case, the Lofdal “2B-4” maintains positive after-tax NPV across all tested price, cost and exchange-rate sensitivity ranges, demonstrating strong downside protection. Under the Divergent Case, after-tax NPV expands materially under higher pricing and remains highly robust under adverse cost scenarios.
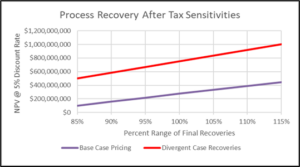
Metallurgical recoveries represent a high impact but controllable value lever for the project:
- Under Base Case pricing, after-tax NPV increases from approximately USD100 million at 85% of expected recoveries to approximately USD440 million at 115% of expected recoveries.
- Under Divergent Case pricing, after-tax NPV increases from approximately USD500 million at 85% of expected recoveries to approximately USD1.0 billion at 115% of expected recoveries.
The linear and consistent response of NPV to recovery improvements demonstrates that ongoing metallurgical optimisation provides meaningful value upside, while the project remains economically viable even at materially lower-than-design recoveries.
Overall Economic Interpretation
The combined cash flow and sensitivity analyses confirm that the project Lofdal “2B-4”:
- Is financially robust under conservative assumptions;
- Exhibits exceptional leverage to critical heavy rare earth pricing, particularly dysprosium, terbium and yttrium;
- Benefits from strong operating margin resilience to cost pressures;
- Generates early and sustained after-tax cash flow, supporting attractive project financeability; and
- Provides significant embedded strategic optionality in a tightening global heavy rare earth supply environment.
Opportunities
The PFS for Lofdal “2B-4” demonstrates that the Lofdal Heavy Rare Earths Project has the potential to be technically and economically viable. The project is technically uncomplicated because of the near surface nature of the deposit and relatively simple access.
Several opportunities are available to further enhance the project:
- Extensive resource below currently planned A4 suitable for underground mining;
- Expansion at Area 2B pit in northeasterly direction with additional resources;
- Additional potential resources in Area 5 prospect with historical HREE mineralized intercepts over 4 km strike length;
- Additional potential mineral resources along the regional scale mineralization trends; and
- Destruction of lixiviant and subsequent neutralisation with magnesium carbonate is costly in the hydrometallurgical flowsheet. Opportunities for acid optimisation and magnesium carbonate reduction should be further investigated.